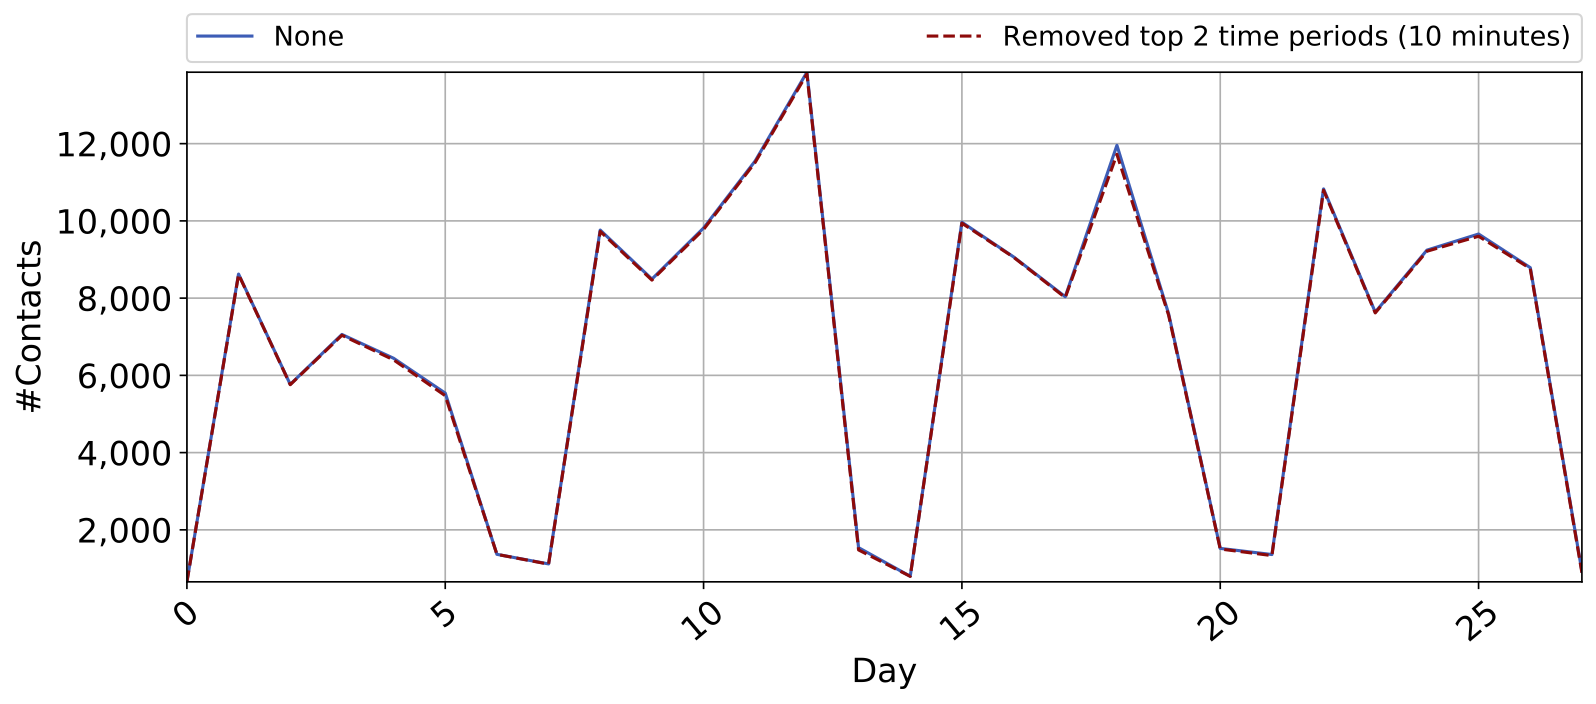
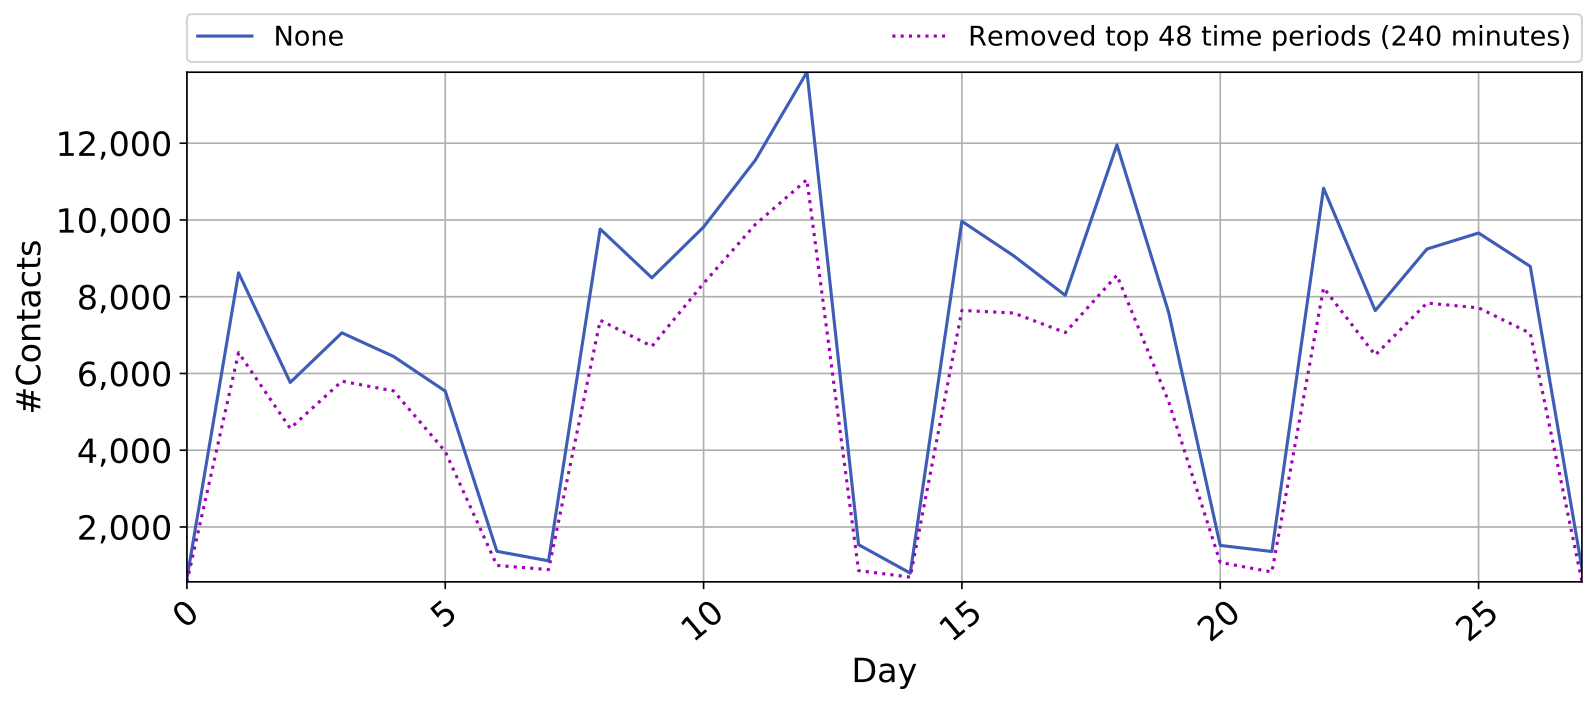
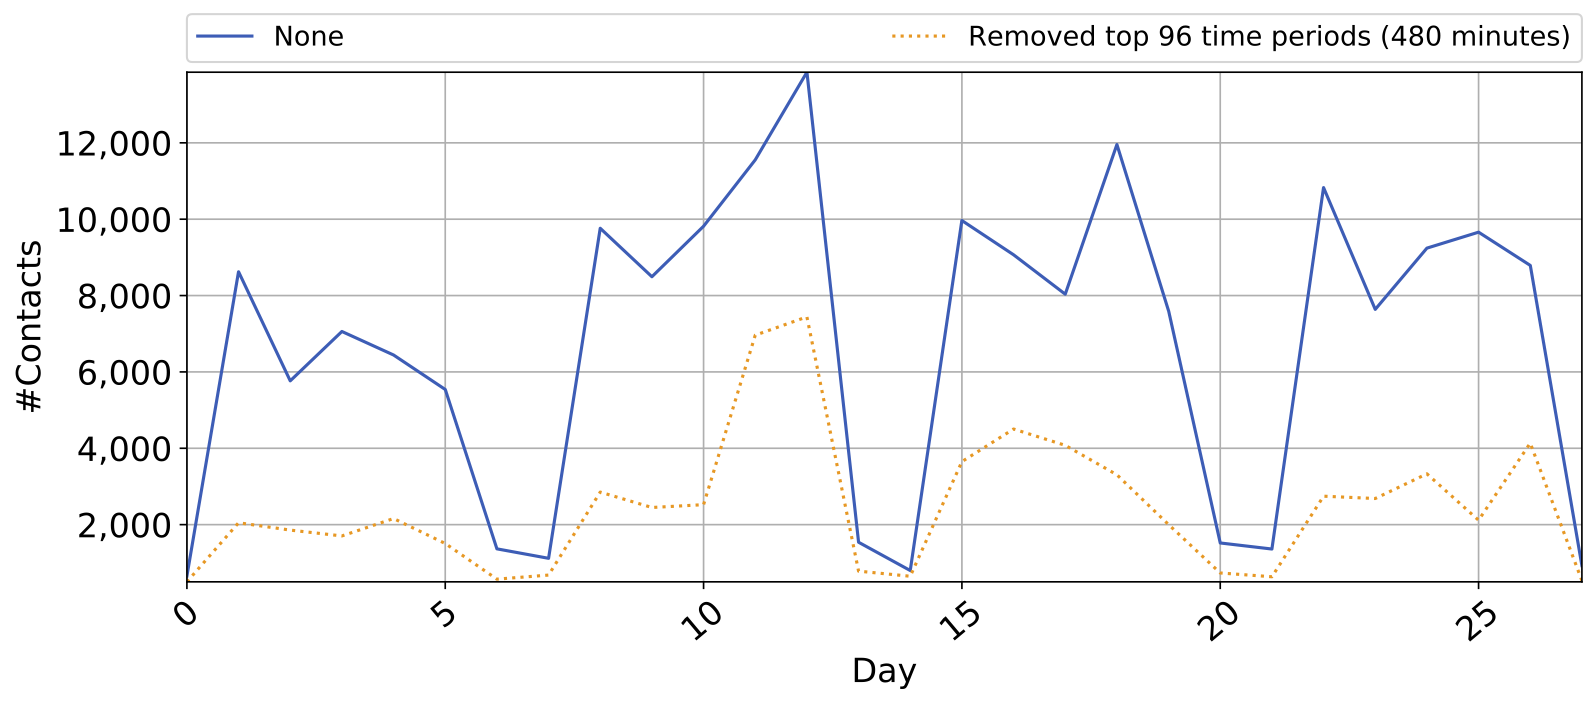
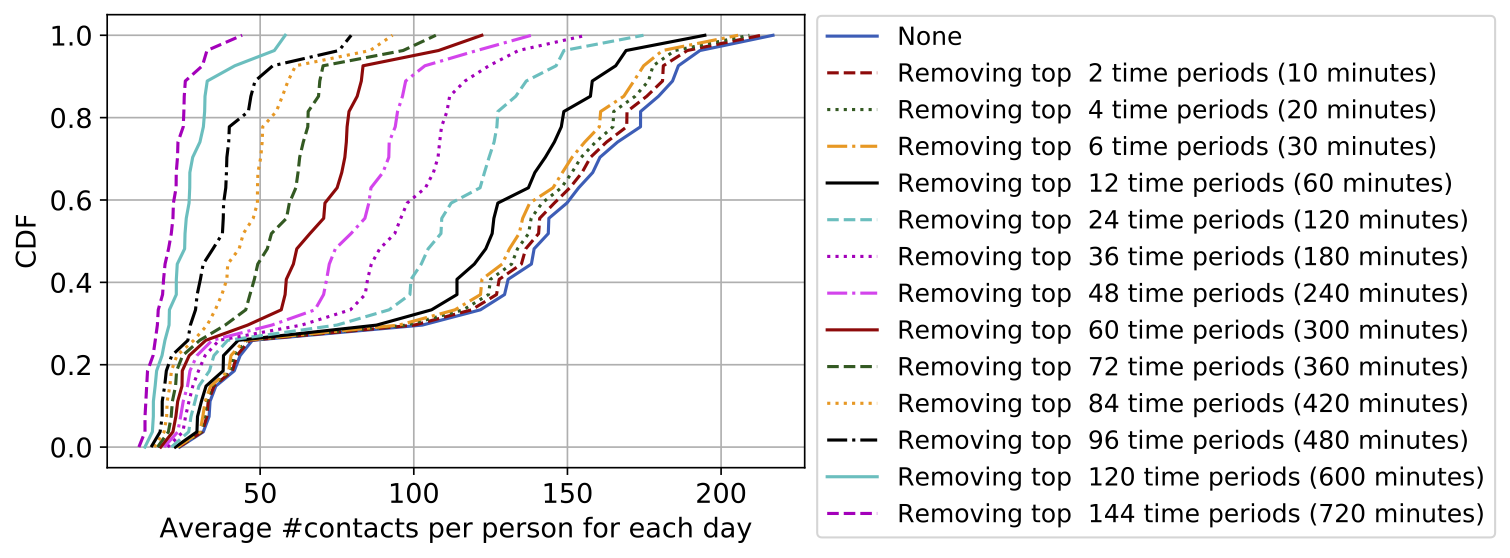
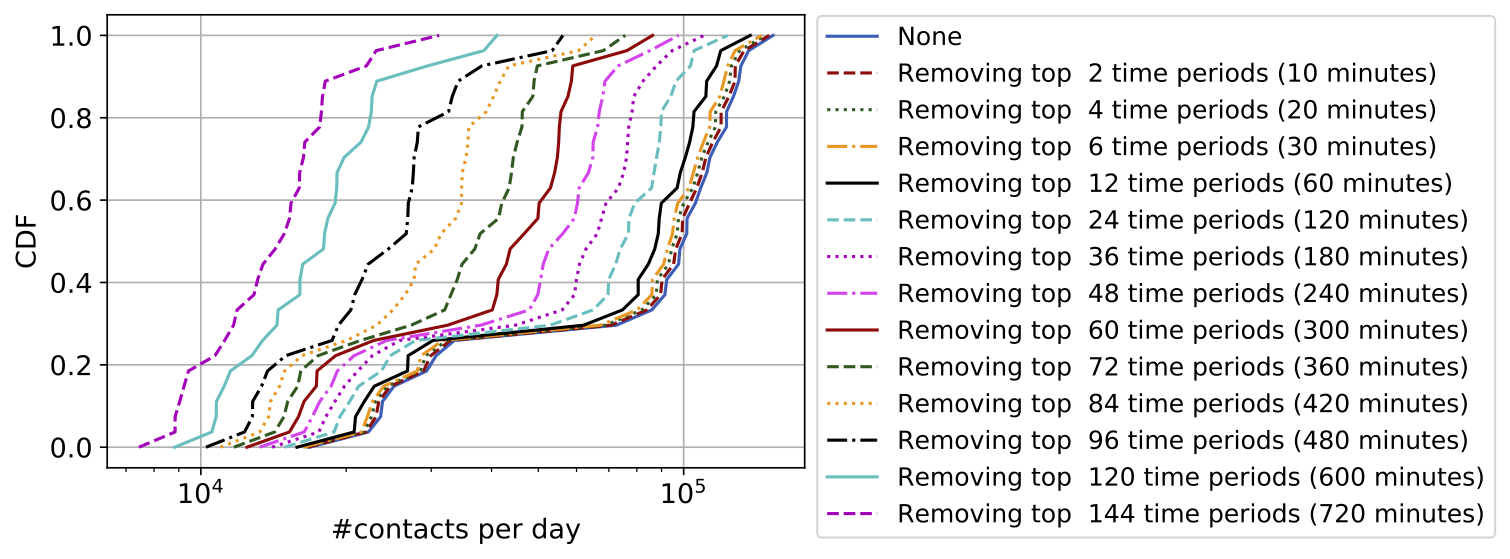
Main Insights: Our experimental results indicate that a large percentage of the contacts per day happen within a few hours. For instance, by looking at the last column of Table 1, we observe that by removing the top 1 hour we remove almost 13% of all contacts and by removing the top 2 hours we remove almost 24% of all contacts. In this setting, if we aim to cut the contacts into half, removing the top 5 hours per day seem to be an effective strategy. We also note that the overwhelming majority of the contacts per day are happening within the top 12-hours (only approximately 17% of the contacts remain). By looking at the temporal plots in Figure 2, we observe that these policies are particularly effective during the weekdays and less during weekends. This is likely because on weekends the numbers of contacts are more spread out with time, while on weekdays most of the contacts are concentrated in a few hours, mainly because of courses, social events, etc.
Enforced Policy |
Mean #contacts per person |
Median # contacts per person |
Mean #contacts per observation |
Median #contacts per observation |
Overall %contacts |
None |
122.73 |
141.46 |
86,648.85 |
99,871 |
100.00% |
Removing top 2 time periods (10 minutes) |
120.08 |
138.51 |
84,777.10 |
97,794 |
97.83% |
Removing top 4 time periods (20 minutes) |
117.49 |
135.54 |
82,951.71 |
95,698 |
95.73% |
Removing top 6 time periods (30 minutes) |
114.96 |
132.70 |
81,167.10 |
93,688 |
93.67% |
Removing top 12 time periods (60 minutes) |
107.66 |
124.46 |
76,010.07 |
87,870 |
87.72% |
Removing top 24 time periods (120 minutes) |
94.05 |
106.75 |
66,399.50 |
75,369 |
76.63% |
Removing top 36 time periods (180 minutes) |
81.70 |
91.35 |
57,684.64 |
64,498 |
66.57% |
Removing top 48 time periods (240 minutes) |
70.46 |
77.02 |
49,746.17 |
54,379 |
57.41% |
Removing top 60 time periods (300 minutes) |
60.22 |
64.06 |
42,516.75 |
45,229 |
49.06% |
Removing top 72 time periods (360 minutes) |
50.93 |
52.99 |
35,961.60 |
37,416 |
41.50% |
Removing top 84 time periods (420 minutes) |
42.77 |
43.85 |
30,196.28 |
30,961 |
34.84% |
Removing top 96 time periods (480 minutes) |
35.64 |
36.18 |
25,168.78 |
25,546 |
29.04% |
Removing top 120 time periods (600 minutes) |
26.27 |
25.48 |
18,551.39 |
17,995 |
21.40% |
Removing top 144 time periods (720 minutes) |
20.73 |
20.64 |
14,639.85 |
14,572 |
16.89% |