Methodology: Here we want to simulate policies which allow specific people to move freely on specific days. An example of such policy is allowing people with odd street numbers to freely move on Monday while people with even street numbers are free to move on Tuesday and so on. To simulate this behavior, we first assign an ID to each person, and then based on the day, we remove the individuals with even or odd ids. That is, on the first day we remove people with even id, on the second day we remove people with odd id, and so on.
Note that since the population of the people is now approximately half in each day, it is likely that people will make contact with other people that would have not before. To better explain this, assume that an individual is attending a conference of 300 people and during the course of the conference he meets with 30 people. Now assume that half of the people did not attend the conference, it is still extremely likely that this specific individual will meet with 30 people, despite the fact that some of the people he would have meet before are not present.
To investigate how the contact network changes under these circumstances, we simulate this behavior by adding random contacts (i.e., re-assigned contacts), to people that have several contacts within the 5-minute interval, after removing half of the population.
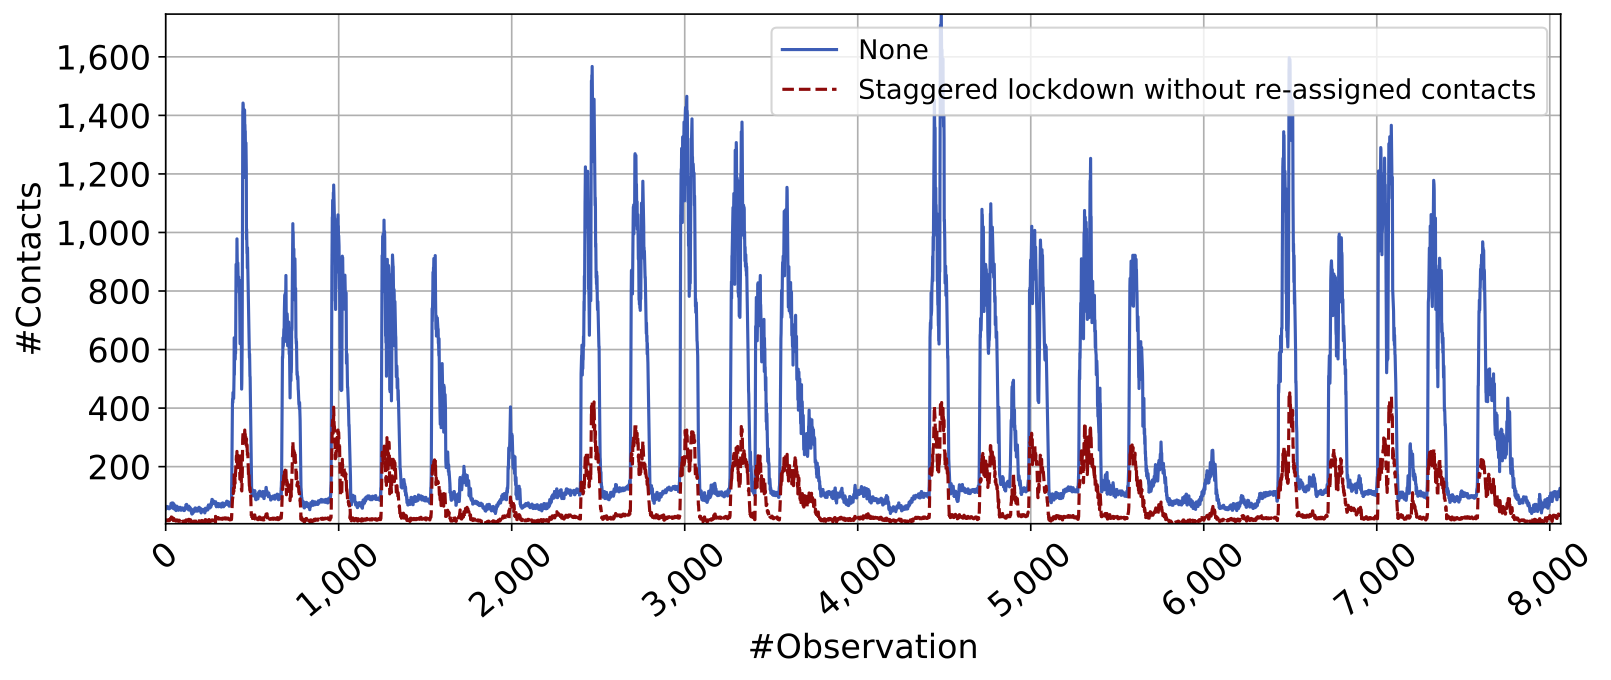
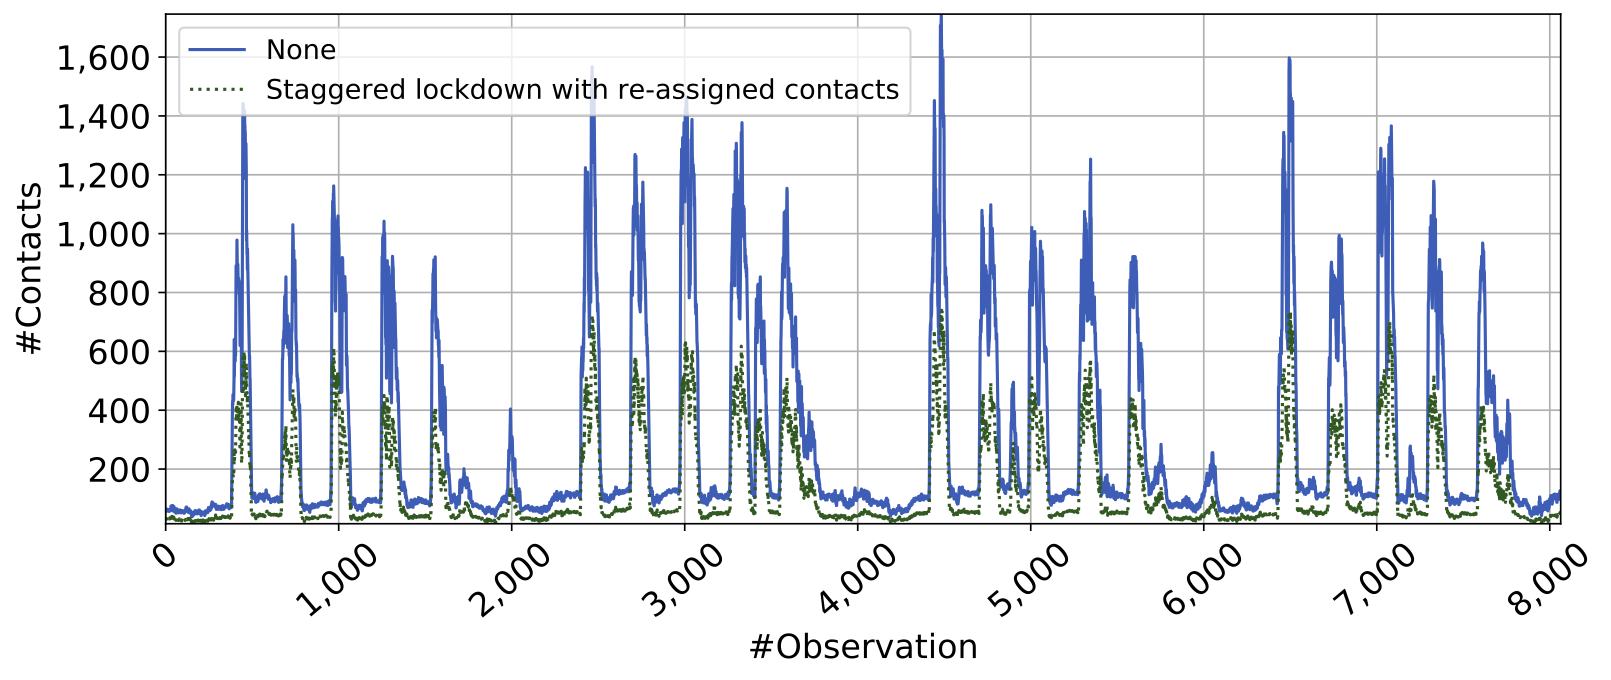
Main Insights: Our experimental results indicate that the policies that are removing half the population on specific days are particularly effective with regards to reducing the number of contacts among people. Specifically, looking at the last column in Table 1, we observe that removing half the population with no extra contacts, results in decreasing the overall percentage of contacts by over 75%. By looking at the results for the case where people make extra contacts with other people (i.e., re-assigned contacts), we observe that it adds an overall of approximately 20% of contacts compared to the case where there are no re-assigned contacts. Finally, we investigate on which points of time, this policy is more effective (e.g., is it effective only on peak times or only on time intervals with a few number of contacts). Figure 2 shows the number of contacts for each 5-minute interval (observation) for the cases of applying the policy with and without re-assigned contacts. We observe that for both cases, these policies are particularly effective on both peak and non-peak hours (compare the difference between the two lines in the figures).
Main Insights: Our experimental results indicate that the policies that are removing half the population on specific days are particularly effective with regards to reducing the number of contacts among people. Specifically, looking at the last column in Table 1, we observe that removing half the population with no extra contacts, results in decreasing the overall percentage of contacts by over 75%. By looking at the results for the case where people make extra contacts with other people (i.e., re-assigned contacts), we observe that it adds an overall of approximately 20% of contacts compared to the case where there are no re-assigned contacts. Finally, we investigate on which points of time, this policy is more effective (e.g., is it effective only on peak times or only on time intervals with a few number of contacts). Figure 2 shows the number of contacts for each 5-minute interval (observation) for the cases of applying the policy with and without re-assigned contacts. We observe that for both cases, these policies are particularly effective on both peak and non-peak hours (compare the difference between the two lines in the figures).
Enforced Policy |
Mean #contacts per person |
Median #contacts per person |
Mean #contacts per observation |
Median #contacts per observation |
Overall %contacts |
None |
0.42 |
0.16 |
300.87 |
115 |
100.00% |
Staggered lockdown without re-assigned contacts |
0.10 |
0.03 |
73.38 |
28 |
24.38% |
Staggered lockdown with re-assigned contacts |
0.18 |
0.07 |
132.43 |
52 |
44.01% |