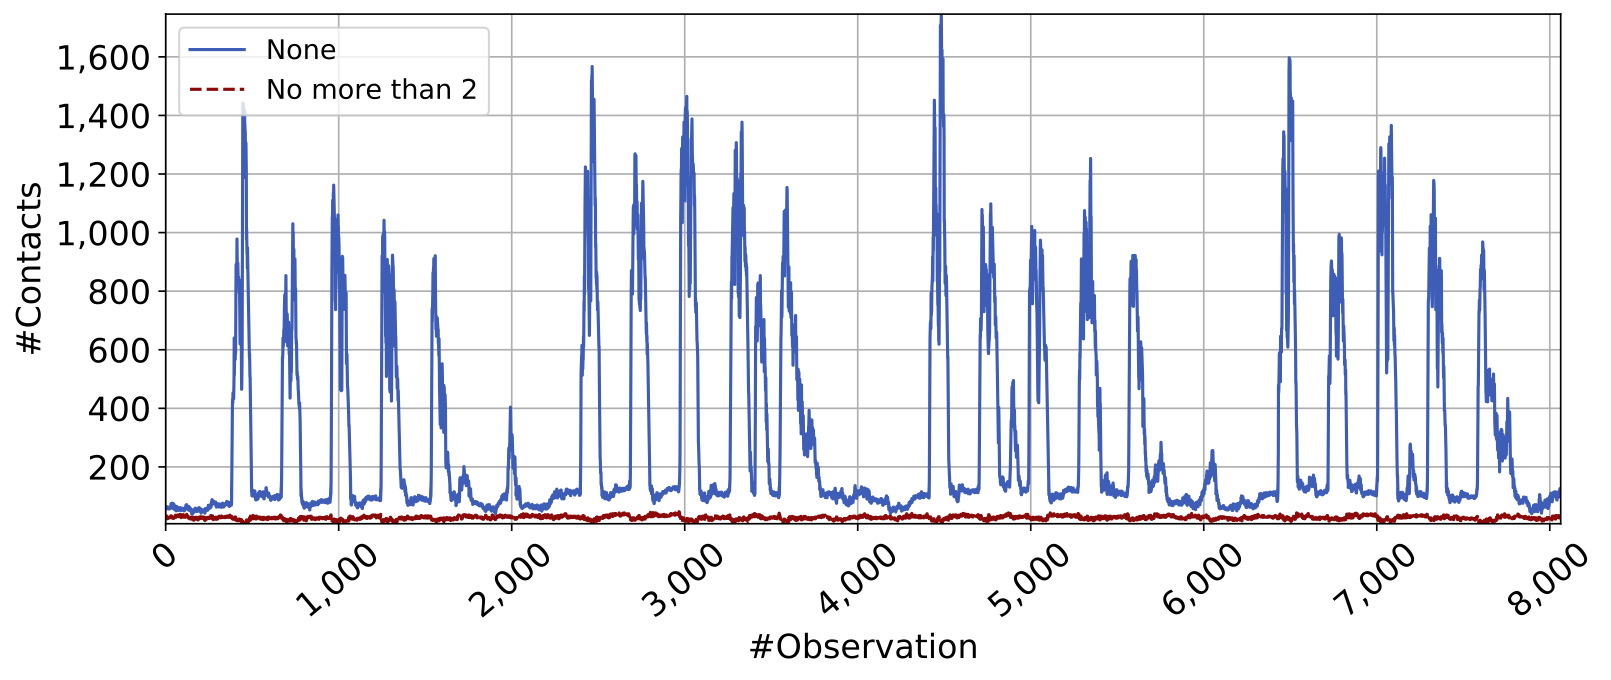
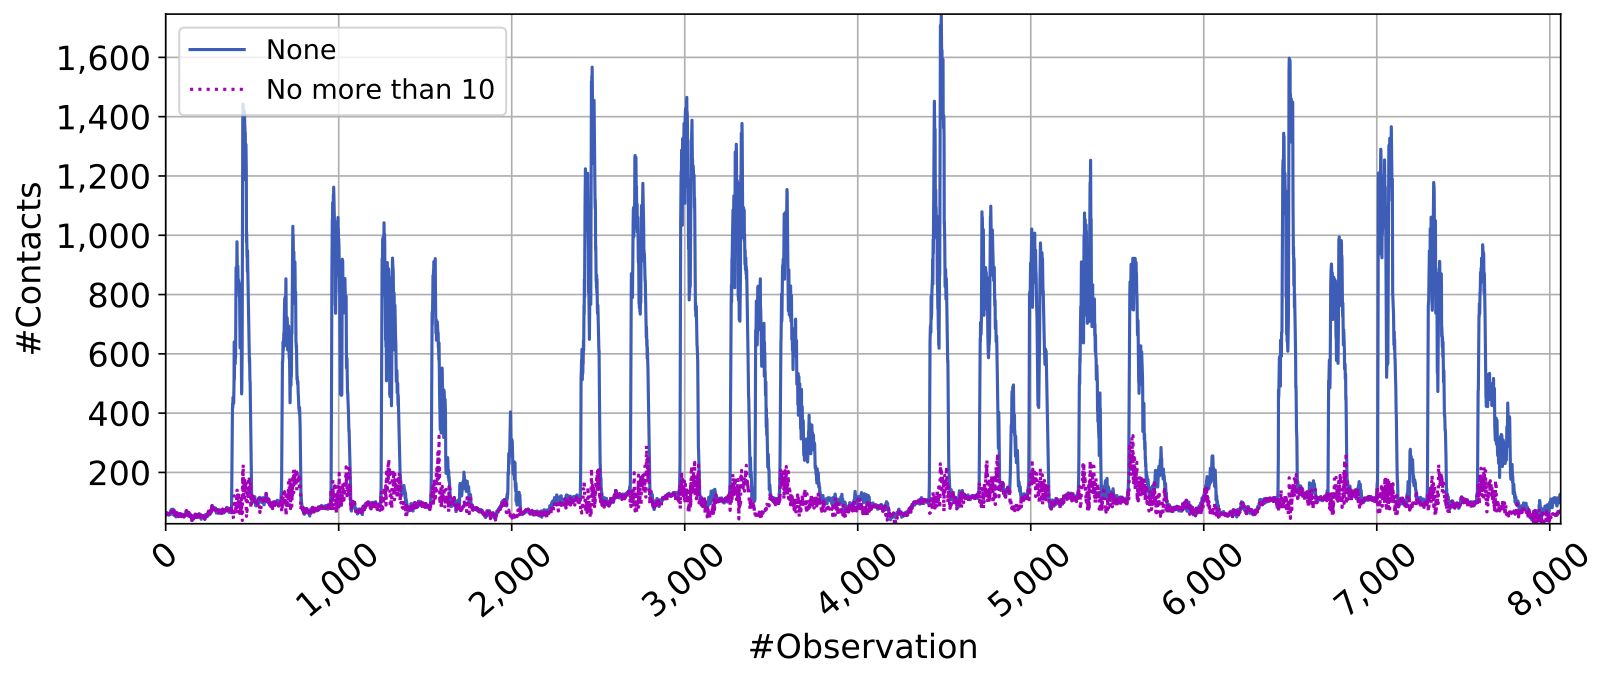
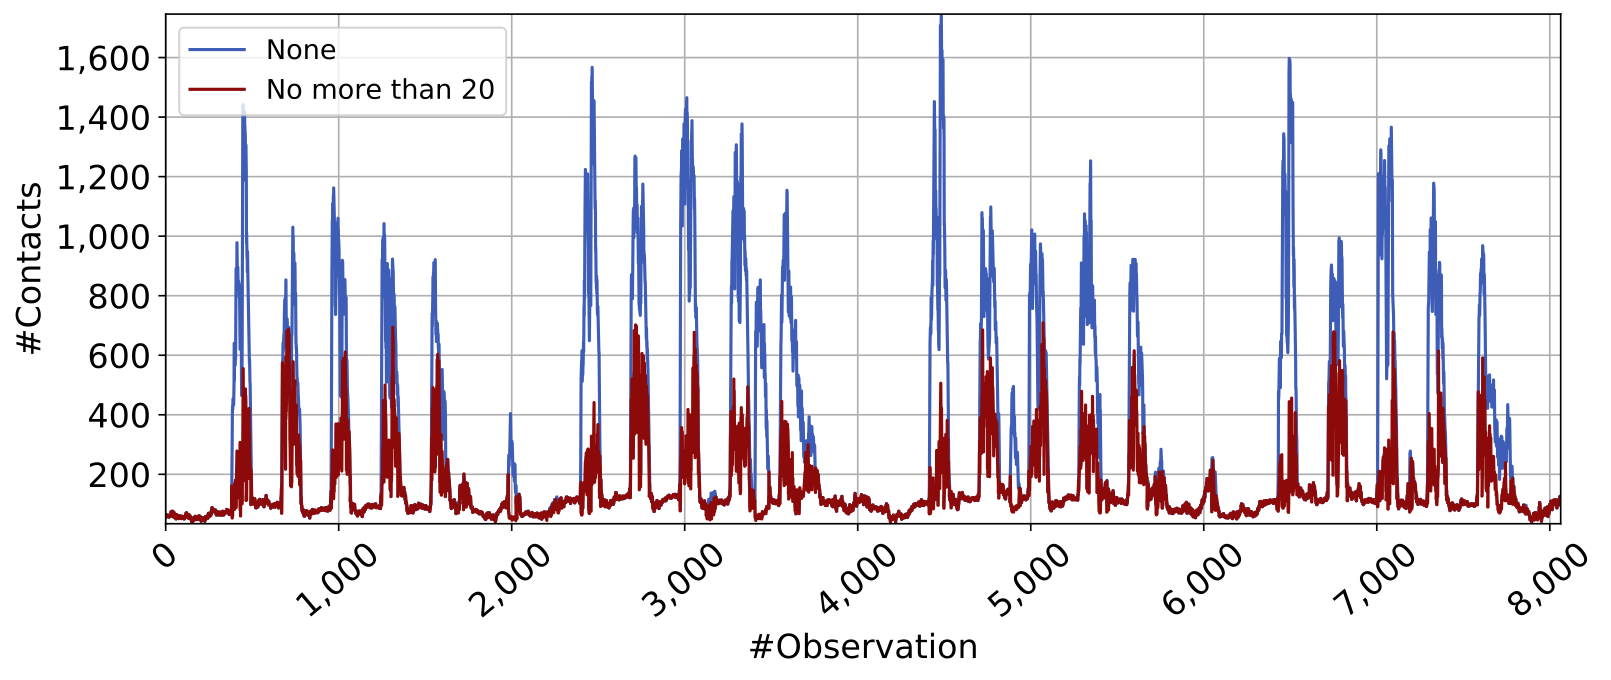
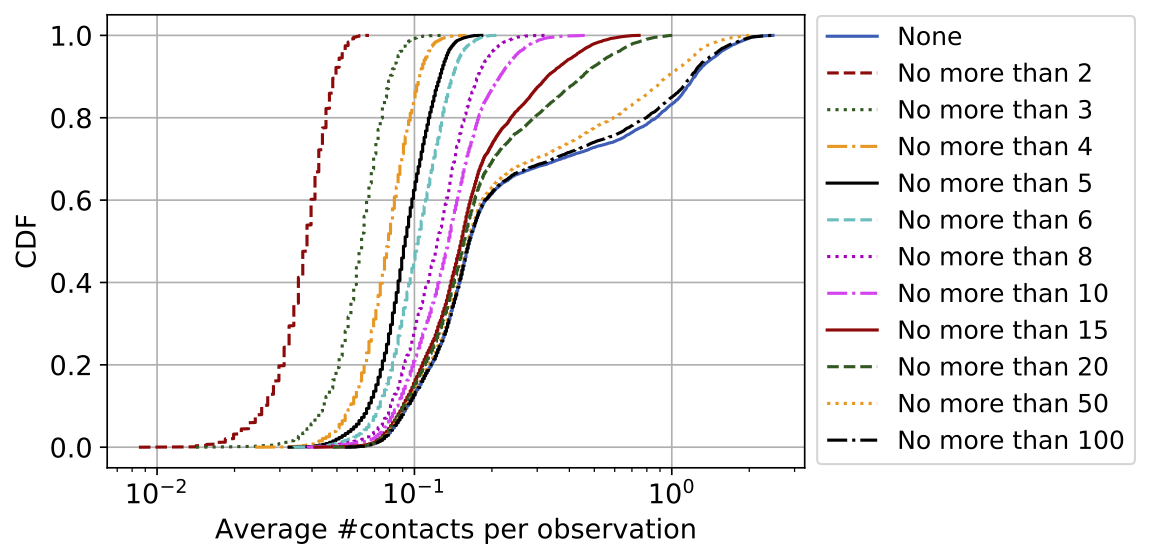
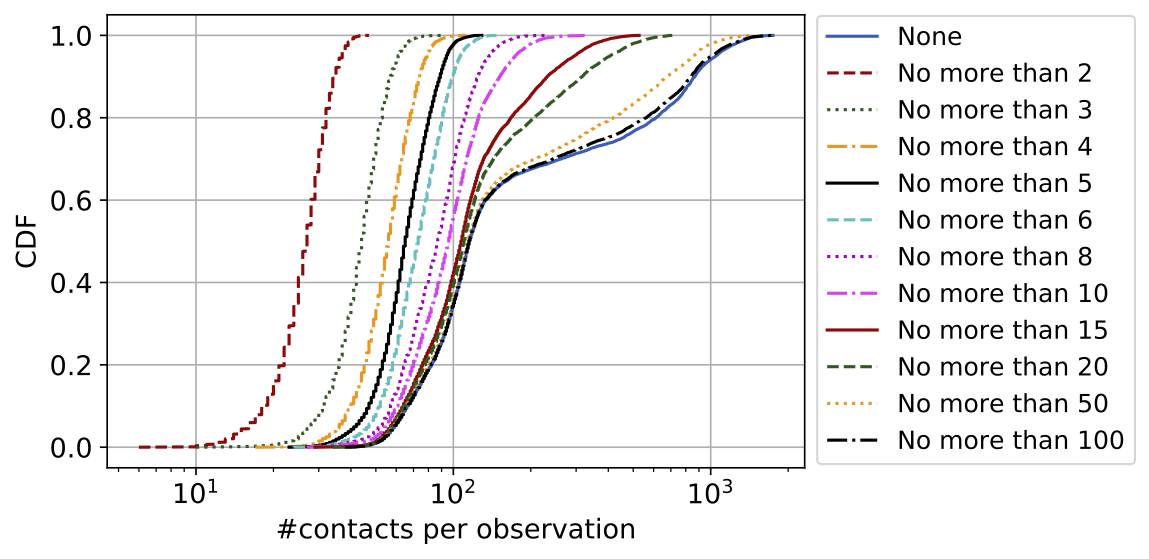
Main Insights: Our experimental results indicate that the policies that are banning assemblies of N people are particularly effective with regards to reducing the number of contacts among people. Specifically, looking at the last column in Table 1, we observe that banning assemblies of more than 2 people causes a reduction of over 91% of all contacts (8.88% of contacts remain after enforcing this policy). By increasing N in our analysis, the percentage of contacts that remain increases, however, we still observe that even banning assemblies of more than 10 people can be effective since it reduces the contacts by almost 2/3. Finally, we investigate on which points of time, this policy is more effective (e.g., is it effective only on peak times or only on time intervals with a few number of contacts). Figure 2 shows the number of contacts for each 5-minute interval (observation) for the cases of applying the policies of banning assemblies of more than 2, 10, and 20 people. By looking at the results for banning assemblies of more than 10 people (figure in the middle), we observe that we gain most of the benefit during peak hours where we have a large number of contacts, while the benefits are not substantial during non-peak intervals likely because there are no big assemblies during that times.
Enforced Policy |
Mean #contacts per person |
Median #contacts per person |
Mean #contacts per observation |
Median #contacts per observation |
Overall %contacts |
None |
0.42 |
0.16 |
300.87 |
115 |
100.00% |
No more than 2 |
0.03 |
0.03 |
26.72 |
27 |
8.88% |
No more than 3 |
0.06 |
0.06 |
44.24 |
44 |
14.70% |
No more than 4 |
0.08 |
0.07 |
56.55 |
55 |
18.79% |
No more than 5 |
0.09 |
0.09 |
66.59 |
65 |
22.13% |
No more than 6 |
0.10 |
0.10 |
74.45 |
73 |
24.74% |
No more than 8 |
0.12 |
0.12 |
89.15 |
87 |
29.63% |
No more than 10 |
0.14 |
0.13 |
101.31 |
96 |
33.67% |
No more than 15 |
0.18 |
0.15 |
129.31 |
107 |
42.97% |
No more than 20 |
0.21 |
0.15 |
151.39 |
110 |
50.31% |
No more than 50 |
0.34 |
0.16 |
244.53 |
114 |
81.27% |
No more than 100 |
0.40 |
0.16 |
288.09 |
115 |
95.75% |