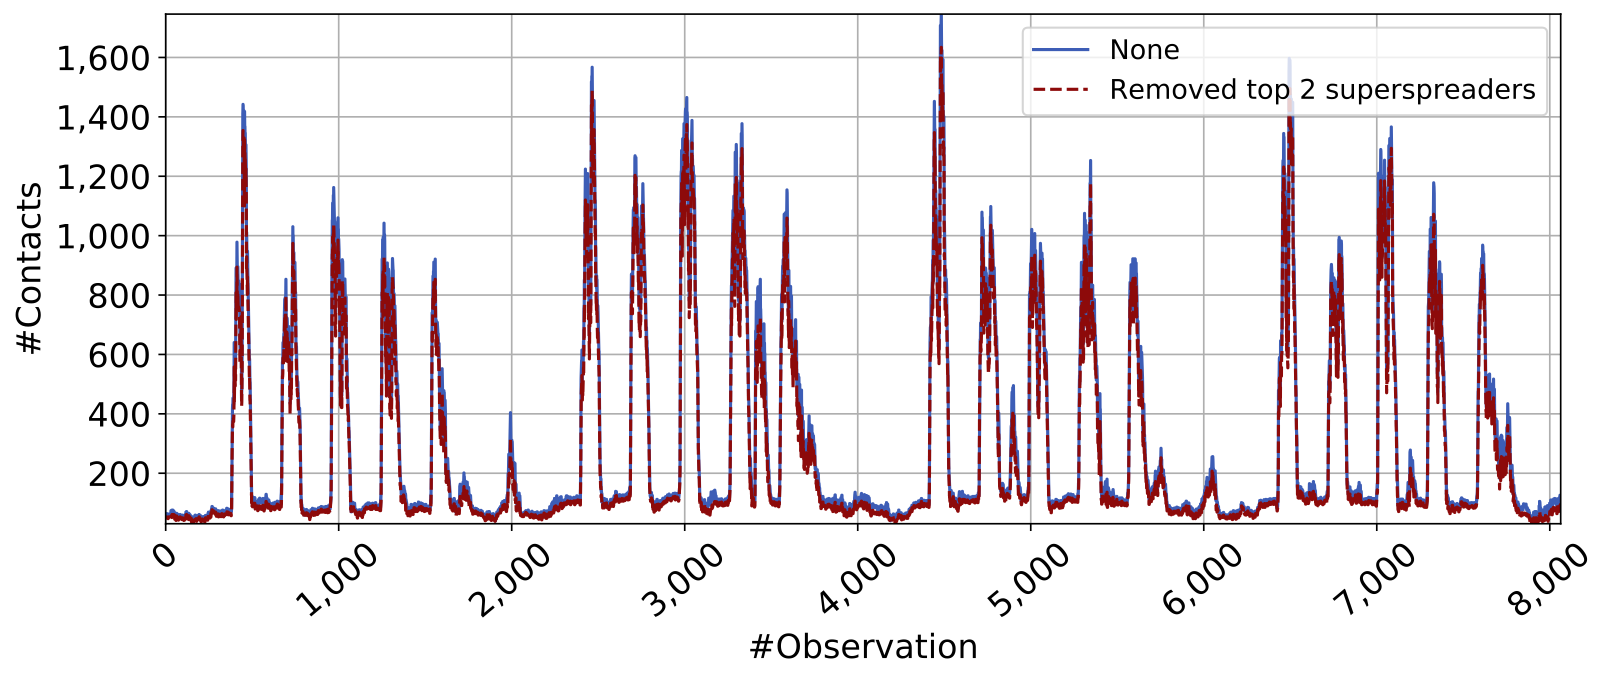
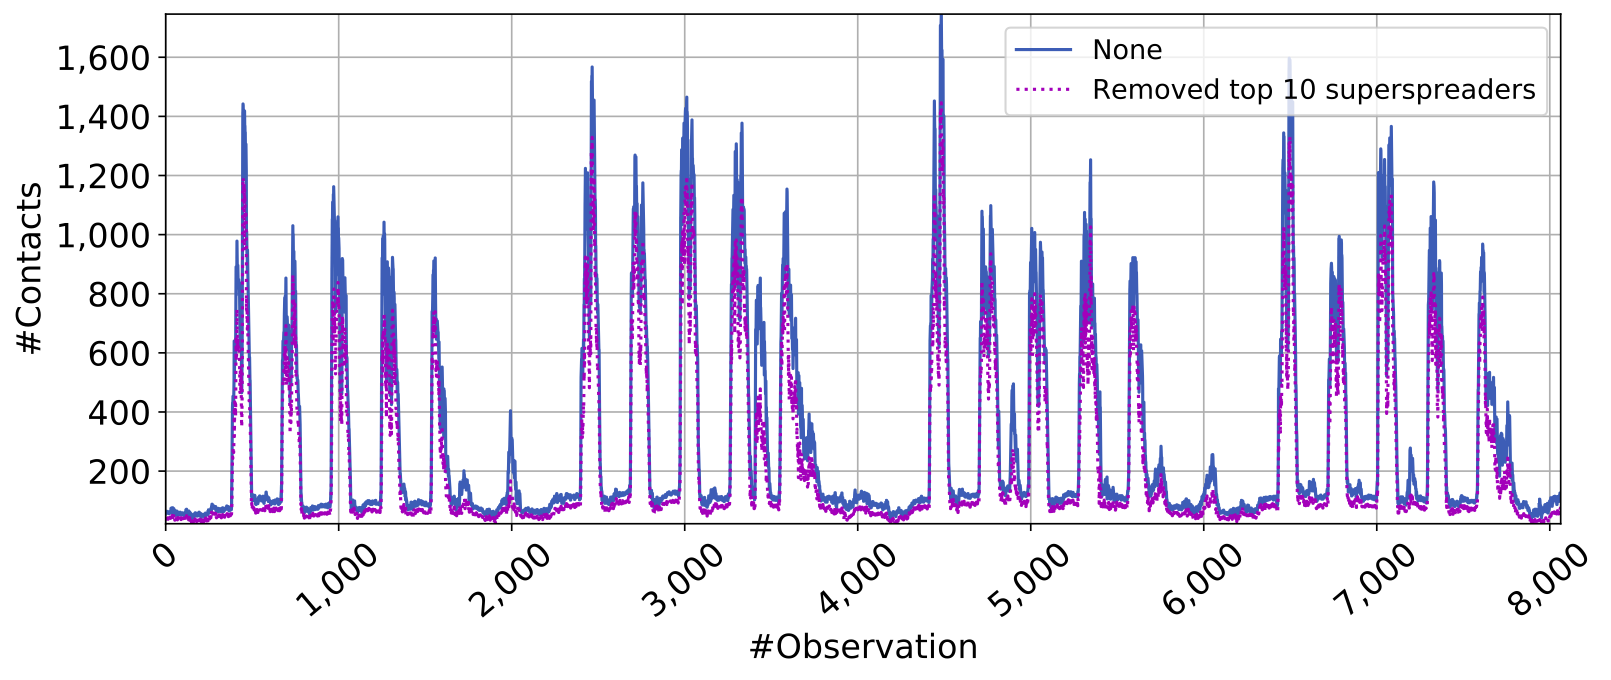
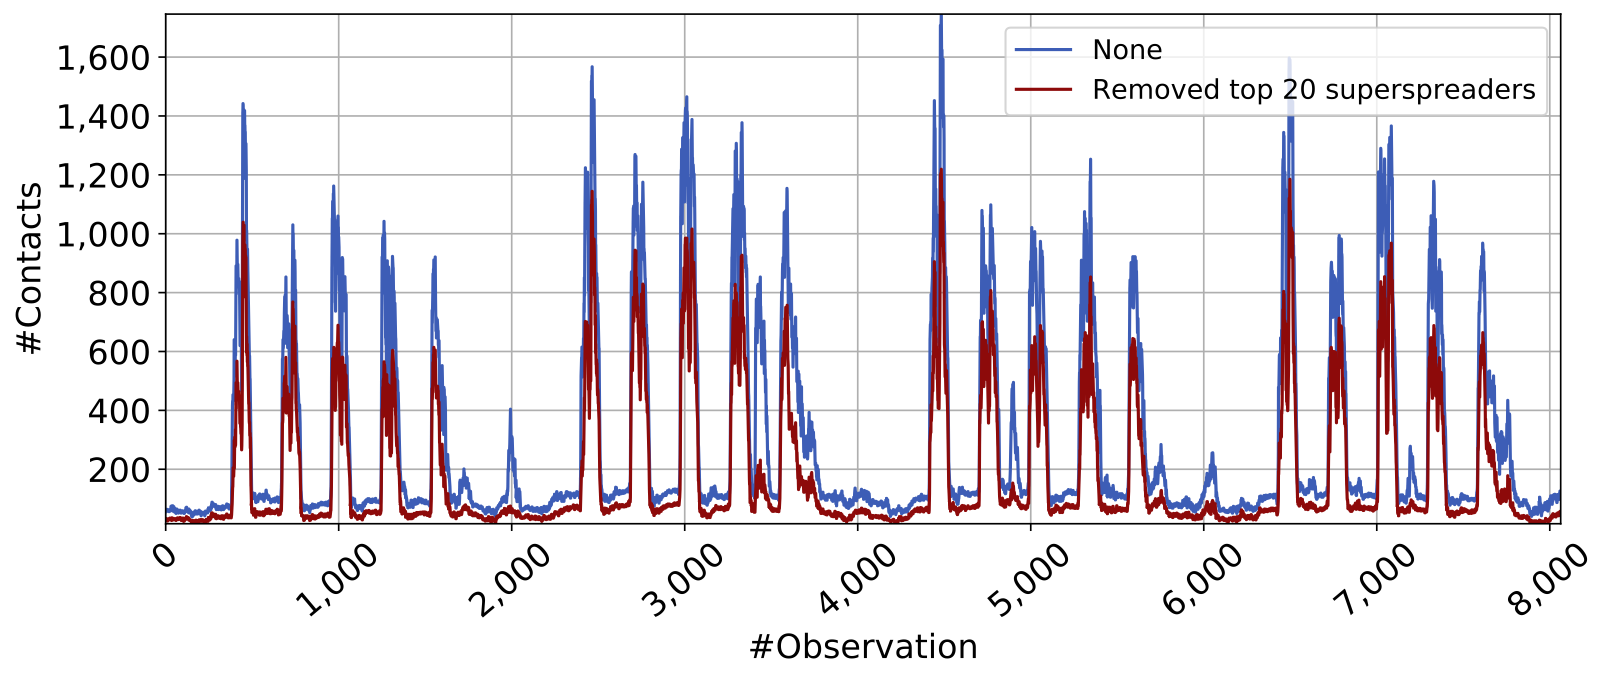
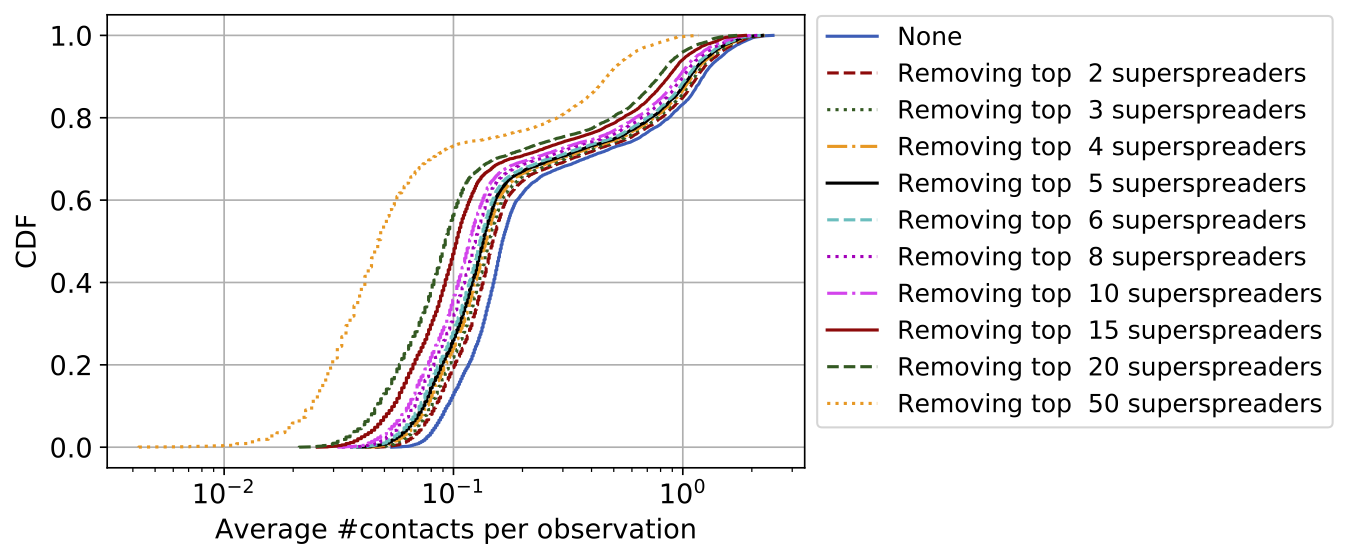
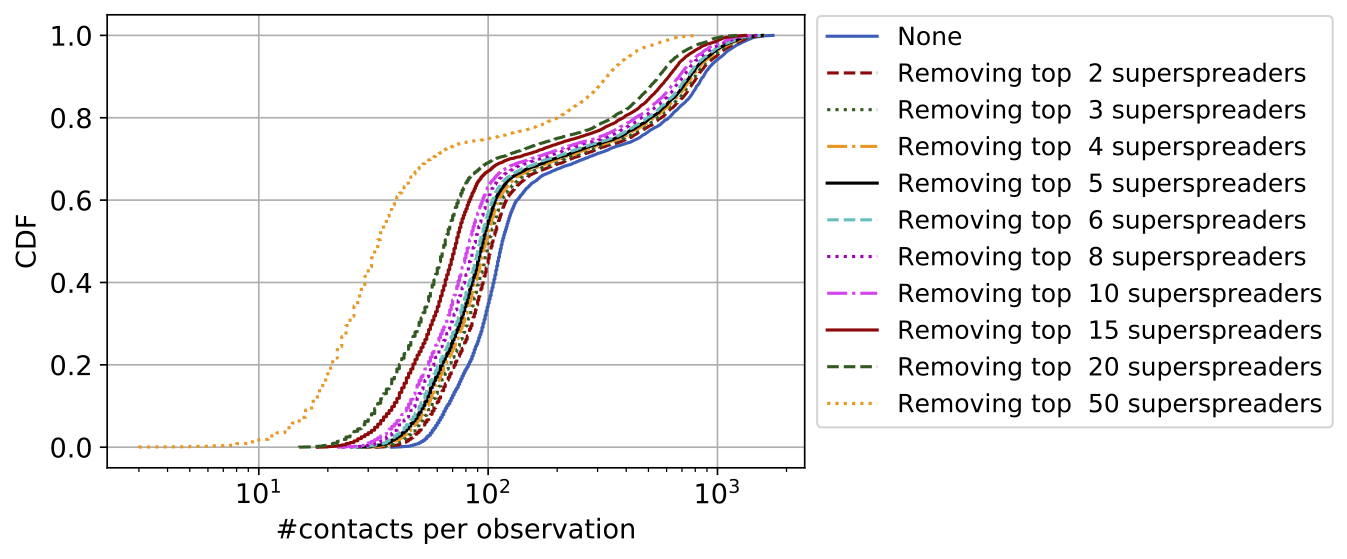
Main Insights: Our experimental results indicate that indeed a small percentage of people are responsible for a large number of contacts in our contact network. For instance, by looking at the last column in Table 1, by removing the top 10 superspreaders (approx. 1% of the entire population), we effectively remove over 26% of all the contacts.
Enforced Policy |
Mean #contacts per person |
Median #contacts per person |
Mean #contacts per observation |
Median #contacts per observation |
Overall %contacts |
None |
0.42 |
0.16 |
300.87 |
115 |
100.00% |
Removing top 2 superspreaders |
0.39 |
0.14 |
278.56 |
105 |
92.58% |
Removing top 3 superspreaders |
0.38 |
0.14 |
269.31 |
101 |
89.50 |
Removing top 4 superspreaders |
0.36 |
0.13 |
260.94 |
98 |
86.72% |
Removing top 5 superspreaders |
0.35 |
0.13 |
253.33 |
95 |
84.20% |
Removing top 6 superspreaders |
0.34 |
0.13 |
246.30 |
92 |
81.86% |
Removing top 8 superspreaders |
0.33 |
0.12 |
233.59 |
88 |
77.63% |
Removing top 10 superspreaders |
0.31 |
0.11 |
222.05 |
83 |
73.80% |
Removing top 15 superspreaders |
0.27 |
0.10 |
197.28 |
73 |
65.56% |
Removing top 20 superspreaders |
0.25 |
0.09 |
177.04 |
65 |
58.84 |
Removing top 50 superspreaders |
0.14 |
0.04 |
102.44 |
33 |
34.04% |